Holger Bauer
2006-01-13 13:12:02 UTC
sorry, if this pops up twice. Think I got the wrong sender email ...
I have an Ensight .case file in the following format:
----------------- dummy.case --------------------------------------
FORMAT
type: ensight
GEOMETRY
model: dummy_exp.GEO
measured: case_iterXX-30K.ensdat
VARIABLE
scalar per measured node: HTRAN case_iterXX-30K.ensdat_htran
scalar per measured node: TEMPERATURE case_iterXX-30K.ensdat_temp
----------------------------------------------------------------------
A dummy geometry file (basically containing just a boundary box with 6
cells)
was created as Ensight needs some underlaying geometry (dummy_exp.GEO).
What I need to display are actually scalar values on a point cloud.
So I was advised to put these scalars into three files:
case_iterXX-30K.ensdat contains just the xyz point locations
case_iterXX-30K.ensdat_htran contains first scalar value for the measured
points
case_iterXX-30K.ensdat_temp contains second scalar value for the measured
points
Ensight is able to display color according to the scalar values for the
points.
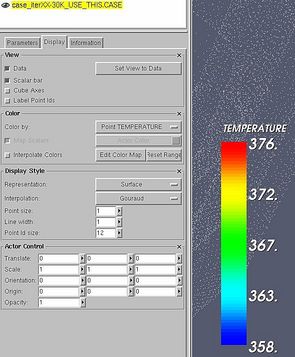
Paraview successfully reads in the dummy geometry, the points and the
scalar
values, allows me to select the two scalar values (HTRAN/Temperature) in
the
color section of the Display tab but the points are not colorized at all.
So I tried to set interpolation to 'flat' instead of 'Gouraud', changed
representation to point instead of surface and so on. But still no
success.
I had compiled paraview myself using these options:
BUILD_SHARED_LIBS OFF
CMAKE_BACKWARDS_COMPATIBILITY 2.2
CMAKE_BUILD_TYPE
CMAKE_INSTALL_PREFIX /home/xxxx/opt/paraview
VTK_USE_CG_SHADERS OFF
VTK_USE_GLSL_SHADERS ON
I had also tried 'VTK_USE_GLSL_SHADERS OFF'.
Is there anything I am missing?
As I said: Ensight has no trouble setting colors according to the scalars.
By the way the scalar range is read in correctly as can be seen by
displaying
the scalar bar and exploring the range there.
- Holger -
I have an Ensight .case file in the following format:
----------------- dummy.case --------------------------------------
FORMAT
type: ensight
GEOMETRY
model: dummy_exp.GEO
measured: case_iterXX-30K.ensdat
VARIABLE
scalar per measured node: HTRAN case_iterXX-30K.ensdat_htran
scalar per measured node: TEMPERATURE case_iterXX-30K.ensdat_temp
----------------------------------------------------------------------
A dummy geometry file (basically containing just a boundary box with 6
cells)
was created as Ensight needs some underlaying geometry (dummy_exp.GEO).
What I need to display are actually scalar values on a point cloud.
So I was advised to put these scalars into three files:
case_iterXX-30K.ensdat contains just the xyz point locations
case_iterXX-30K.ensdat_htran contains first scalar value for the measured
points
case_iterXX-30K.ensdat_temp contains second scalar value for the measured
points
Ensight is able to display color according to the scalar values for the
points.
Paraview successfully reads in the dummy geometry, the points and the
scalar
values, allows me to select the two scalar values (HTRAN/Temperature) in
the
color section of the Display tab but the points are not colorized at all.
So I tried to set interpolation to 'flat' instead of 'Gouraud', changed
representation to point instead of surface and so on. But still no
success.
I had compiled paraview myself using these options:
BUILD_SHARED_LIBS OFF
CMAKE_BACKWARDS_COMPATIBILITY 2.2
CMAKE_BUILD_TYPE
CMAKE_INSTALL_PREFIX /home/xxxx/opt/paraview
VTK_USE_CG_SHADERS OFF
VTK_USE_GLSL_SHADERS ON
I had also tried 'VTK_USE_GLSL_SHADERS OFF'.
Is there anything I am missing?
As I said: Ensight has no trouble setting colors according to the scalars.
By the way the scalar range is read in correctly as can be seen by
displaying
the scalar bar and exploring the range there.
- Holger -